October
See it in 30 minutes
October Insights · For business leaders

Understand your people.
Run a stronger business.

Powerful, aggregated information to help you lead. See how your organisation is doing, understand what is behind the numbers and turn that understanding into action.

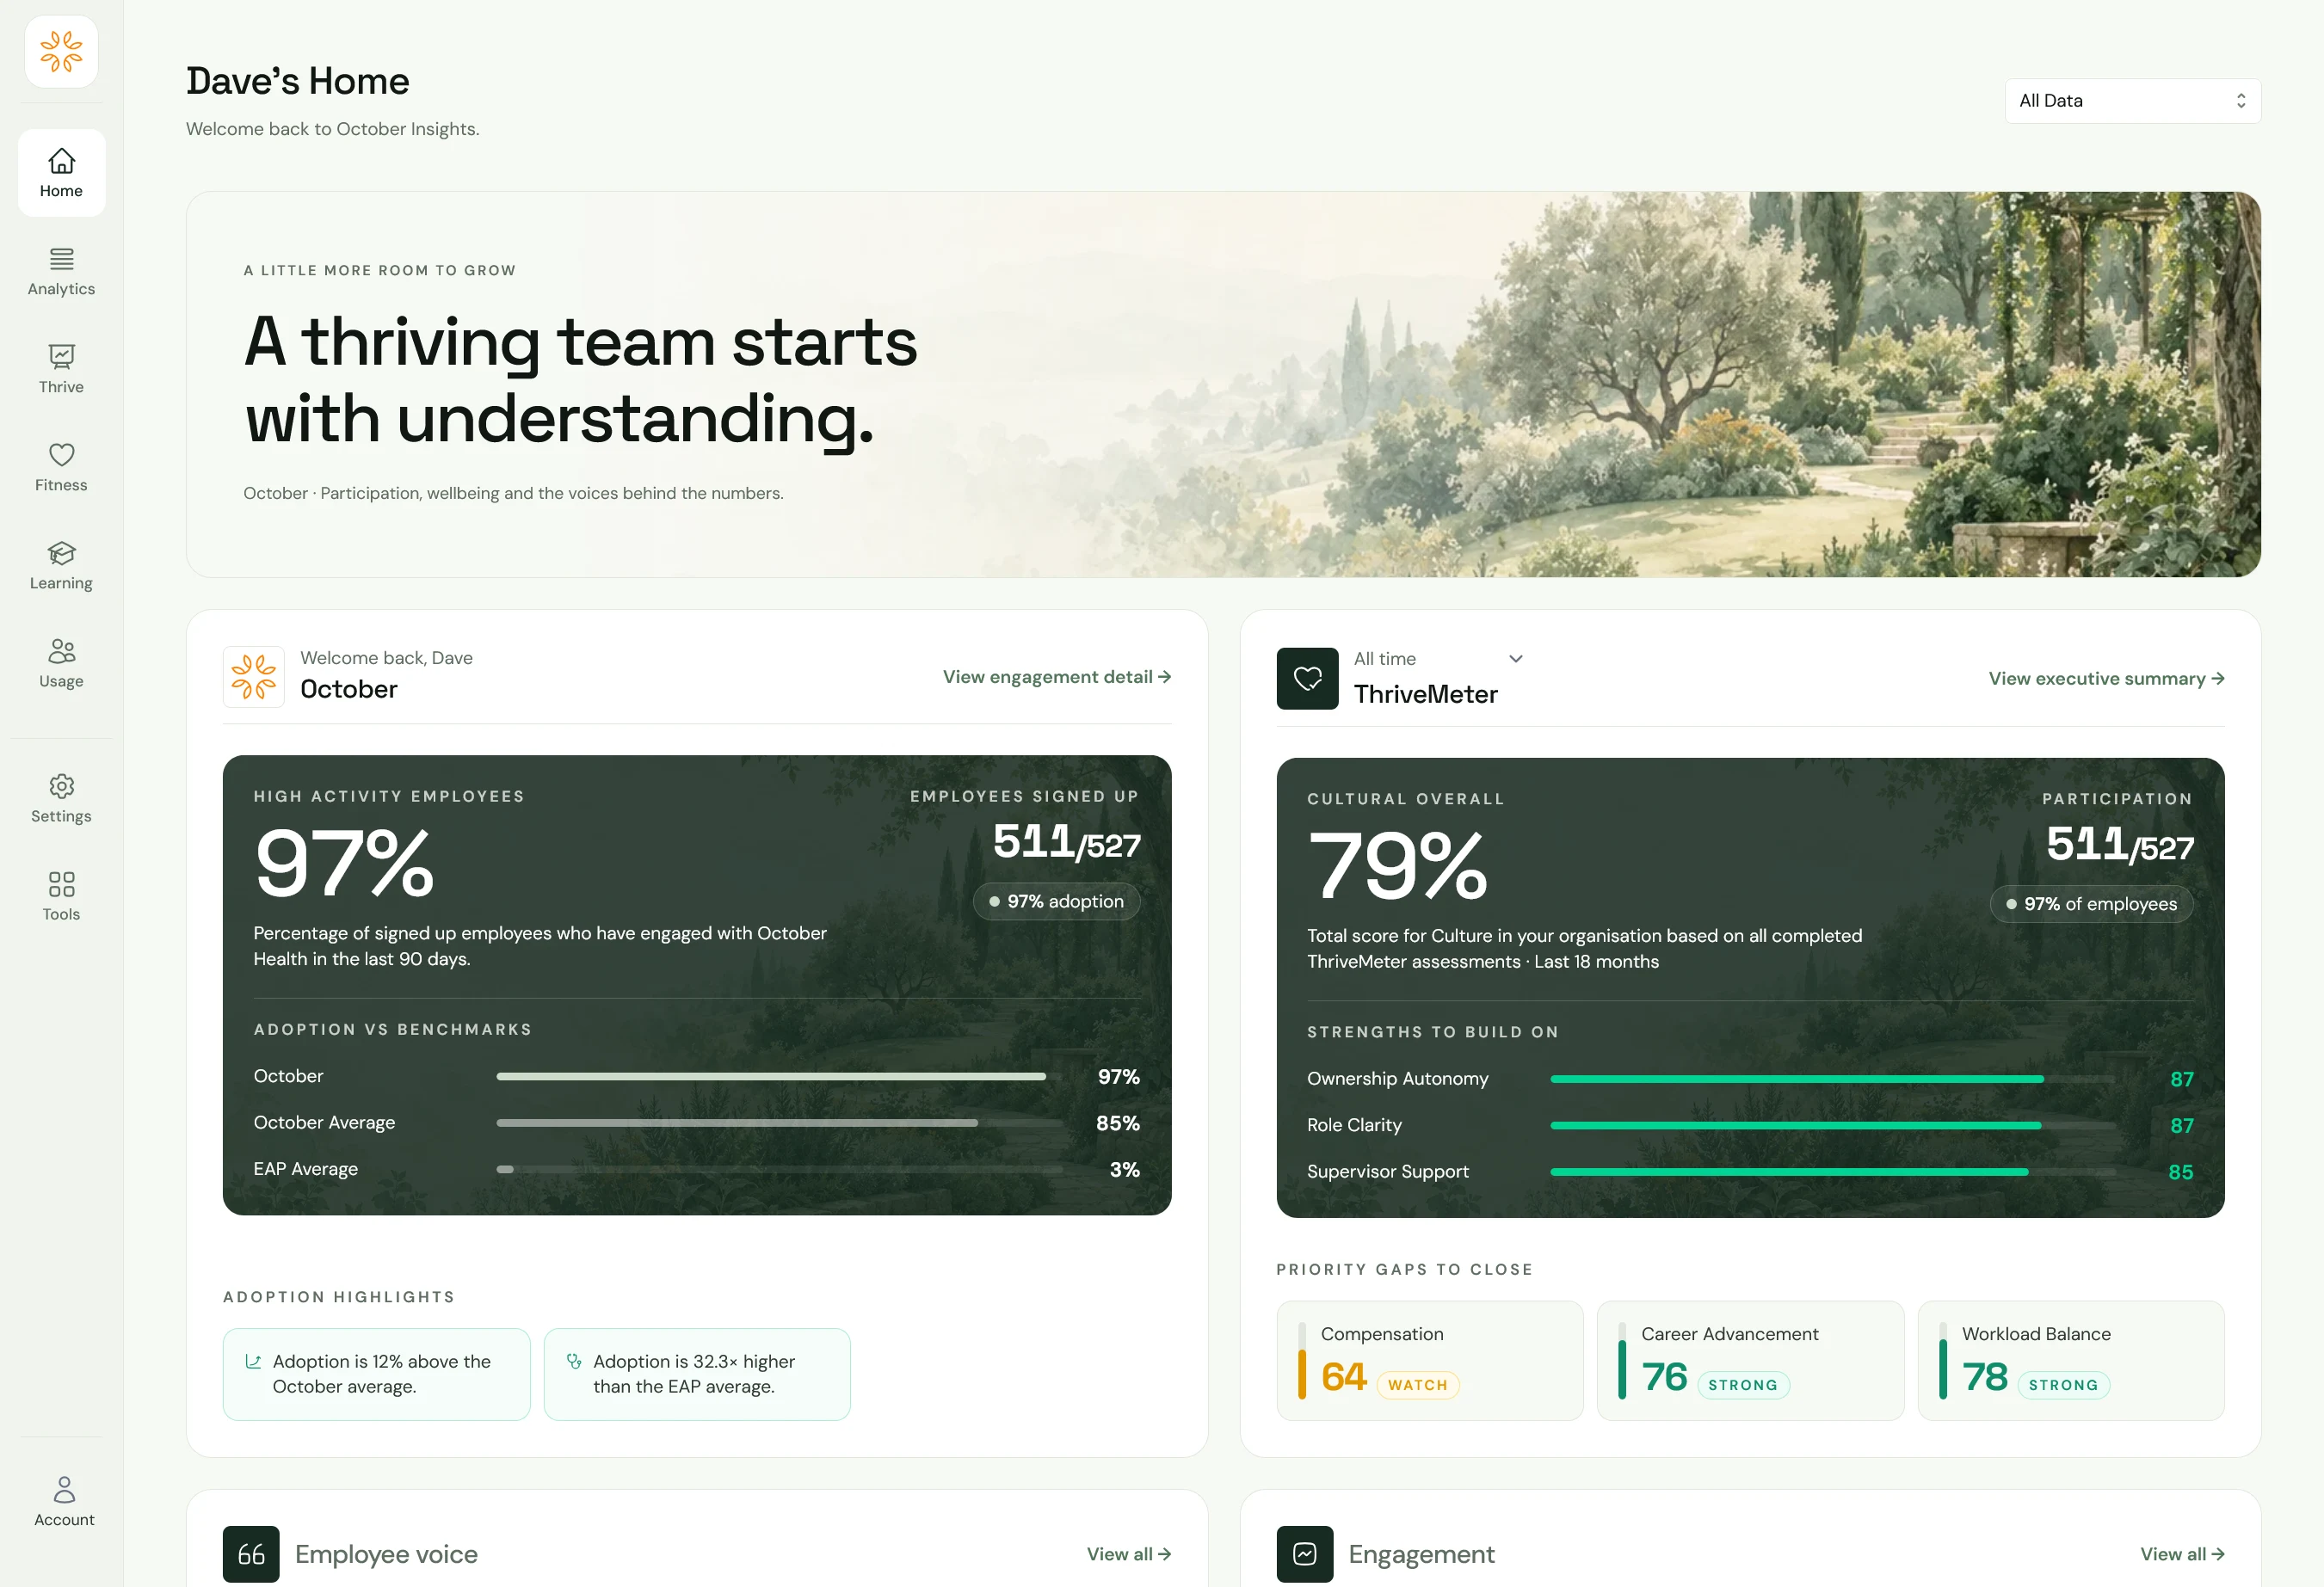
October Insights home with engagement, participation and ThriveMeter summaries, strengths and priority gaps
Inside October Insights · Product screenshots show a specific organisation and reporting period.
Quarterly
ThriveMeter reporting, with a weekly wellbeing signal between
Benchmarked
against organisations using October, on the same basis
10 people
the minimum before a ThriveMeter segment is reported
1 PDF
executive summary, ready for the leadership meeting

Who it’s for

Every leader asks the same thing. Where should we act first?

Insights is for the people who decide where time, money and attention go. Each of them comes to it with a different question.

The chief executive

A leadership meeting next week and a question about morale.

The need

“I need one honest view of how people are doing, not forty slides.”

How October helps

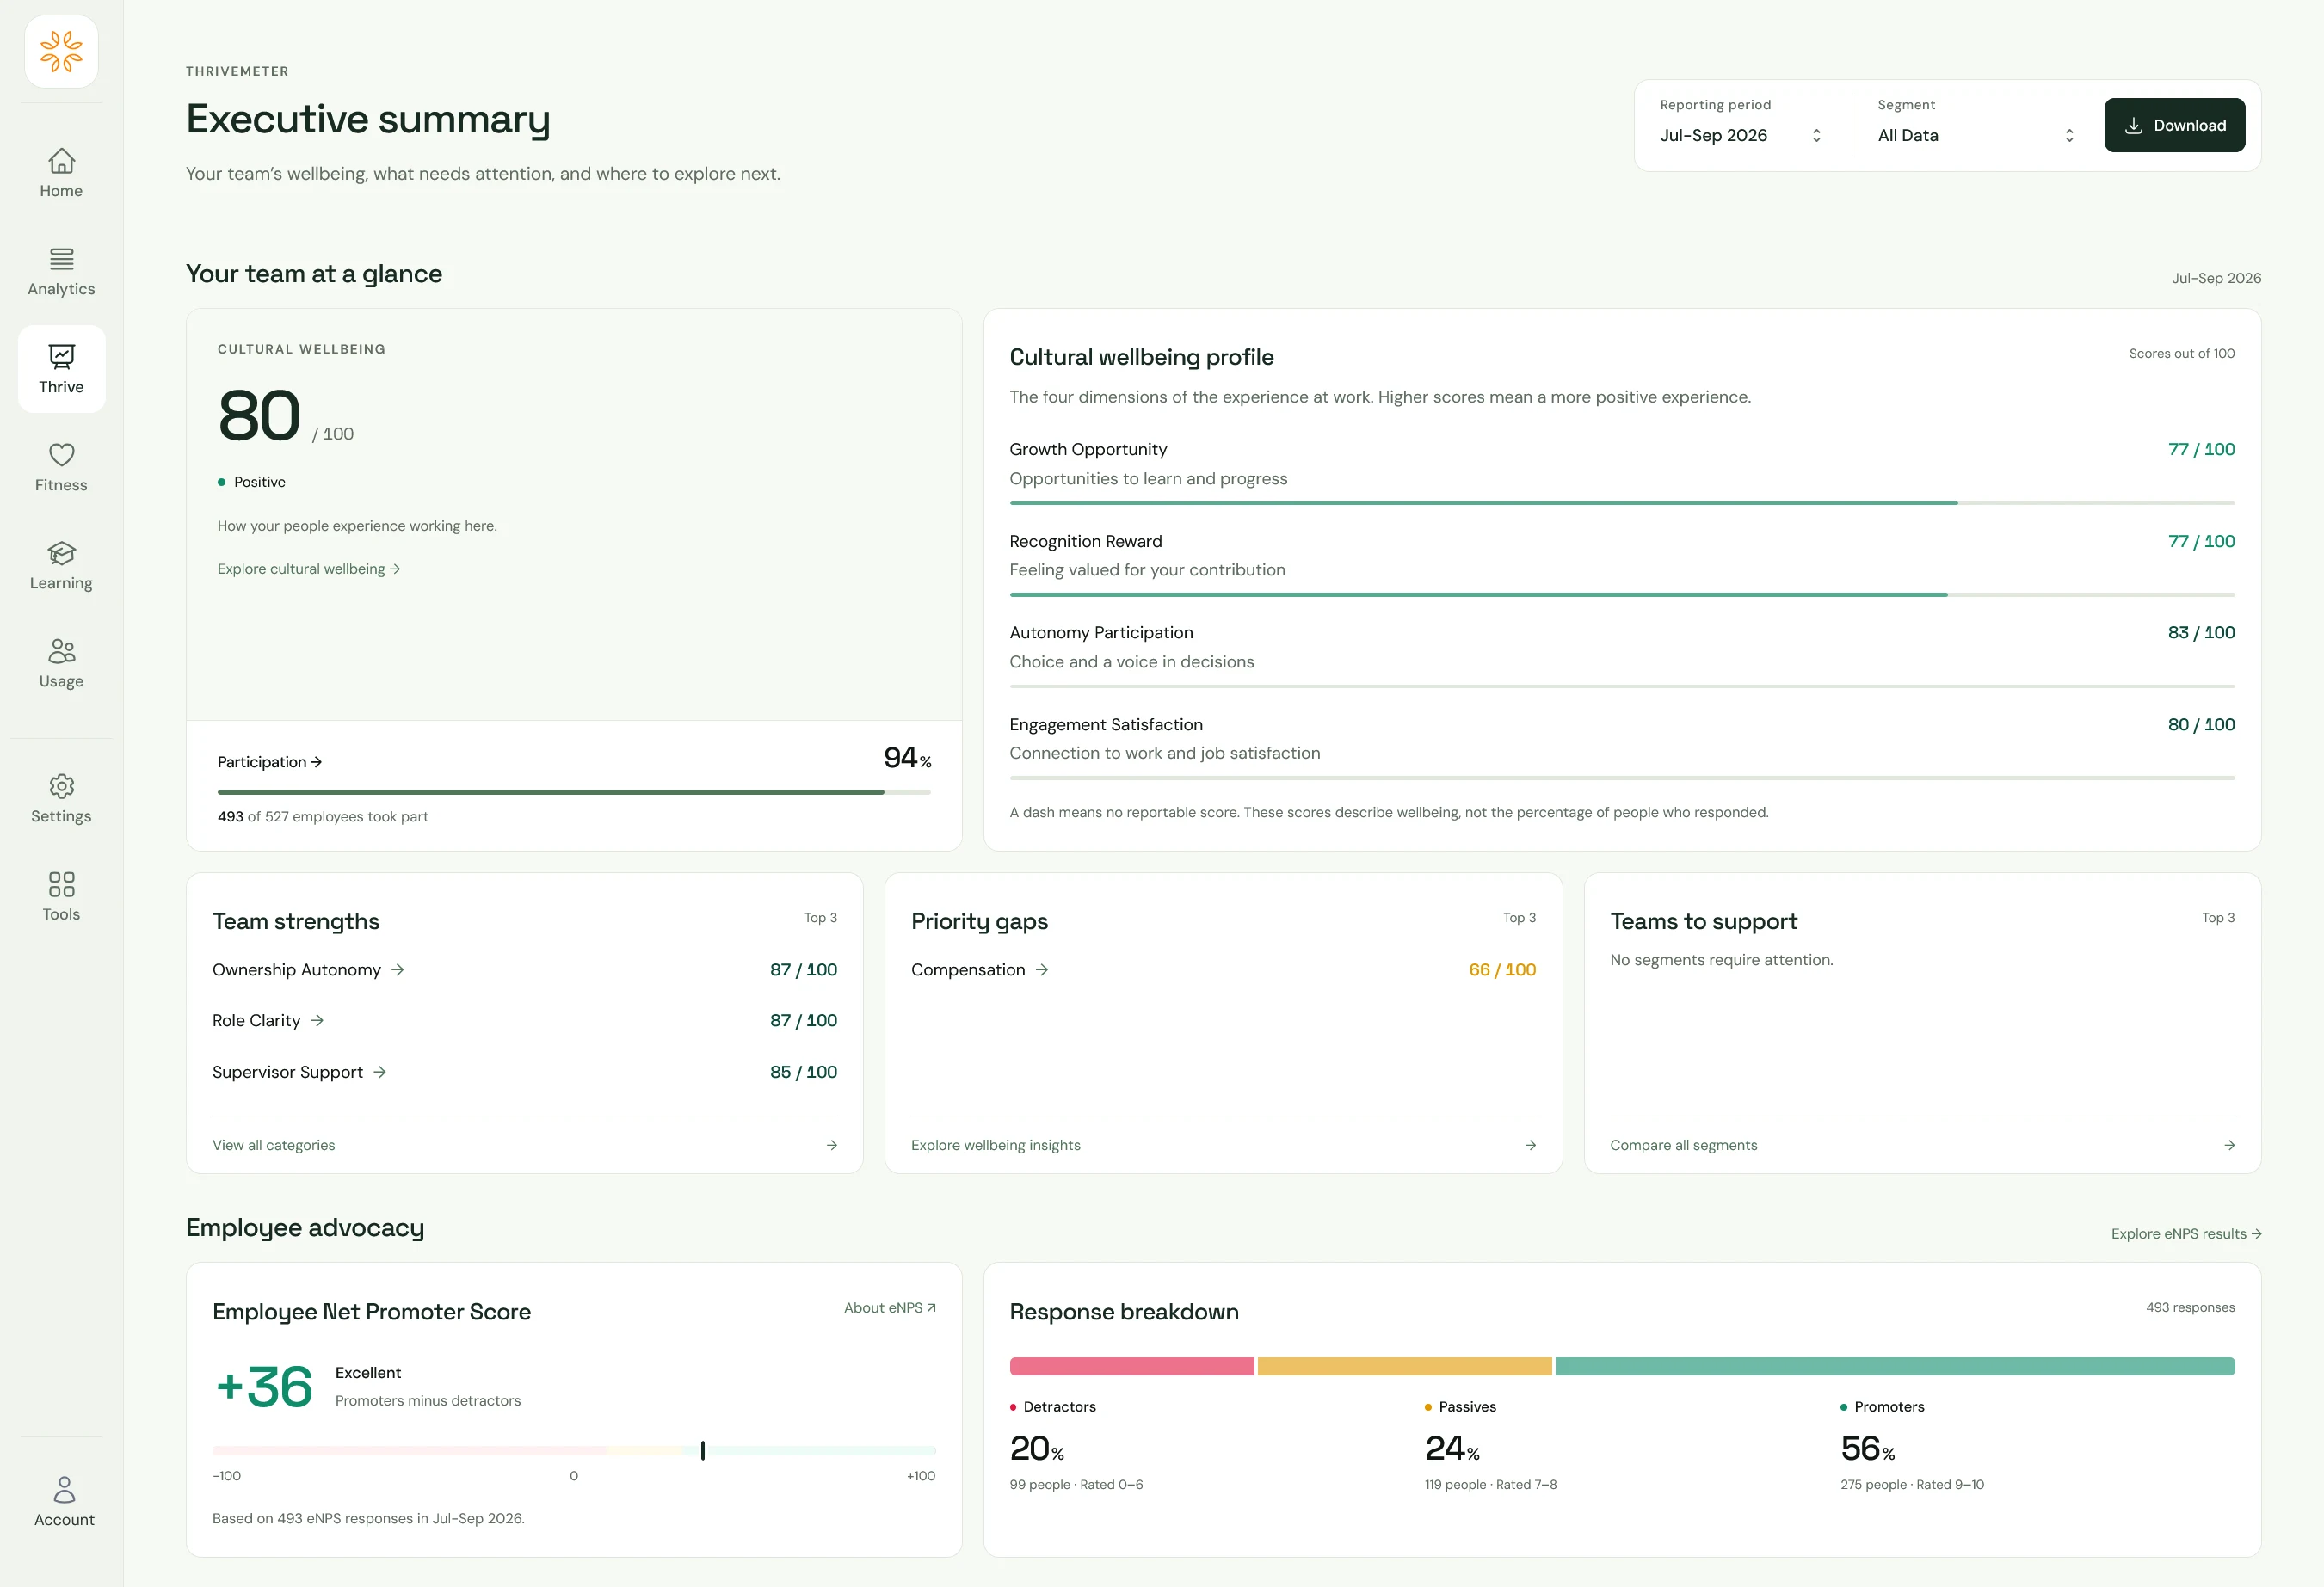
The executive summary brings cultural wellbeing, participation, eNPS, strengths and priority gaps onto one page, and downloads as a PDF for the meeting.
The HR director with one budget

Several requests for programmes, and money for one or two.

The need

“Everything feels urgent. I need to know which problem is biggest, and where.”

How October helps

Priority gaps and the team comparison show which area falls furthest behind the organisation and in which teams, so the spend goes where the gap is.

The operations leader across sites

Shift teams, regions and offices that rarely look alike.

The need

“The company average hides the one site that is struggling.”

How October helps

Segments built from your own groups, such as department or location, sit side by side and are colour-coded against the organisation, so the outlier stands out.

The people team that has to show results

A wellbeing programme launched last quarter.

The need

“The board will ask whether it worked. I need more than usage numbers.”

How October helps

Quarterly ThriveMeter scores and the weekly wellbeing signal show the direction of travel for the same teams, before and after you act.

Why people data stalls

Plenty of data. Not much decided.

TodayAn annual survey arrives as a report months later, describing a team that has already changed.

With OctoberQuarterly ThriveMeter results and a weekly wellbeing signal keep the picture current through the year.

TodayA single company score hides the team that is struggling behind the teams that are fine.

With OctoberEvery reported segment is compared with the organisation, area by area, so the gap shows up where it is.

TodayScores say something is wrong but not why, so leaders guess at the fix.

With OctoberEmployee voice draws out the themes behind the numbers, with AI-estimated sentiment and ideas for what to stop, keep and start.

TodayAction plans get written once and never checked again.

With OctoberEach focus area comes with a first move, likely drivers and how you will know it worked. Next quarter, you check.

Inside October Insights

Where it hurts. Why. And what to do on Monday.

Insights follows the questions a leader actually asks, in the order they ask them.

Where

Find the team behind the average.

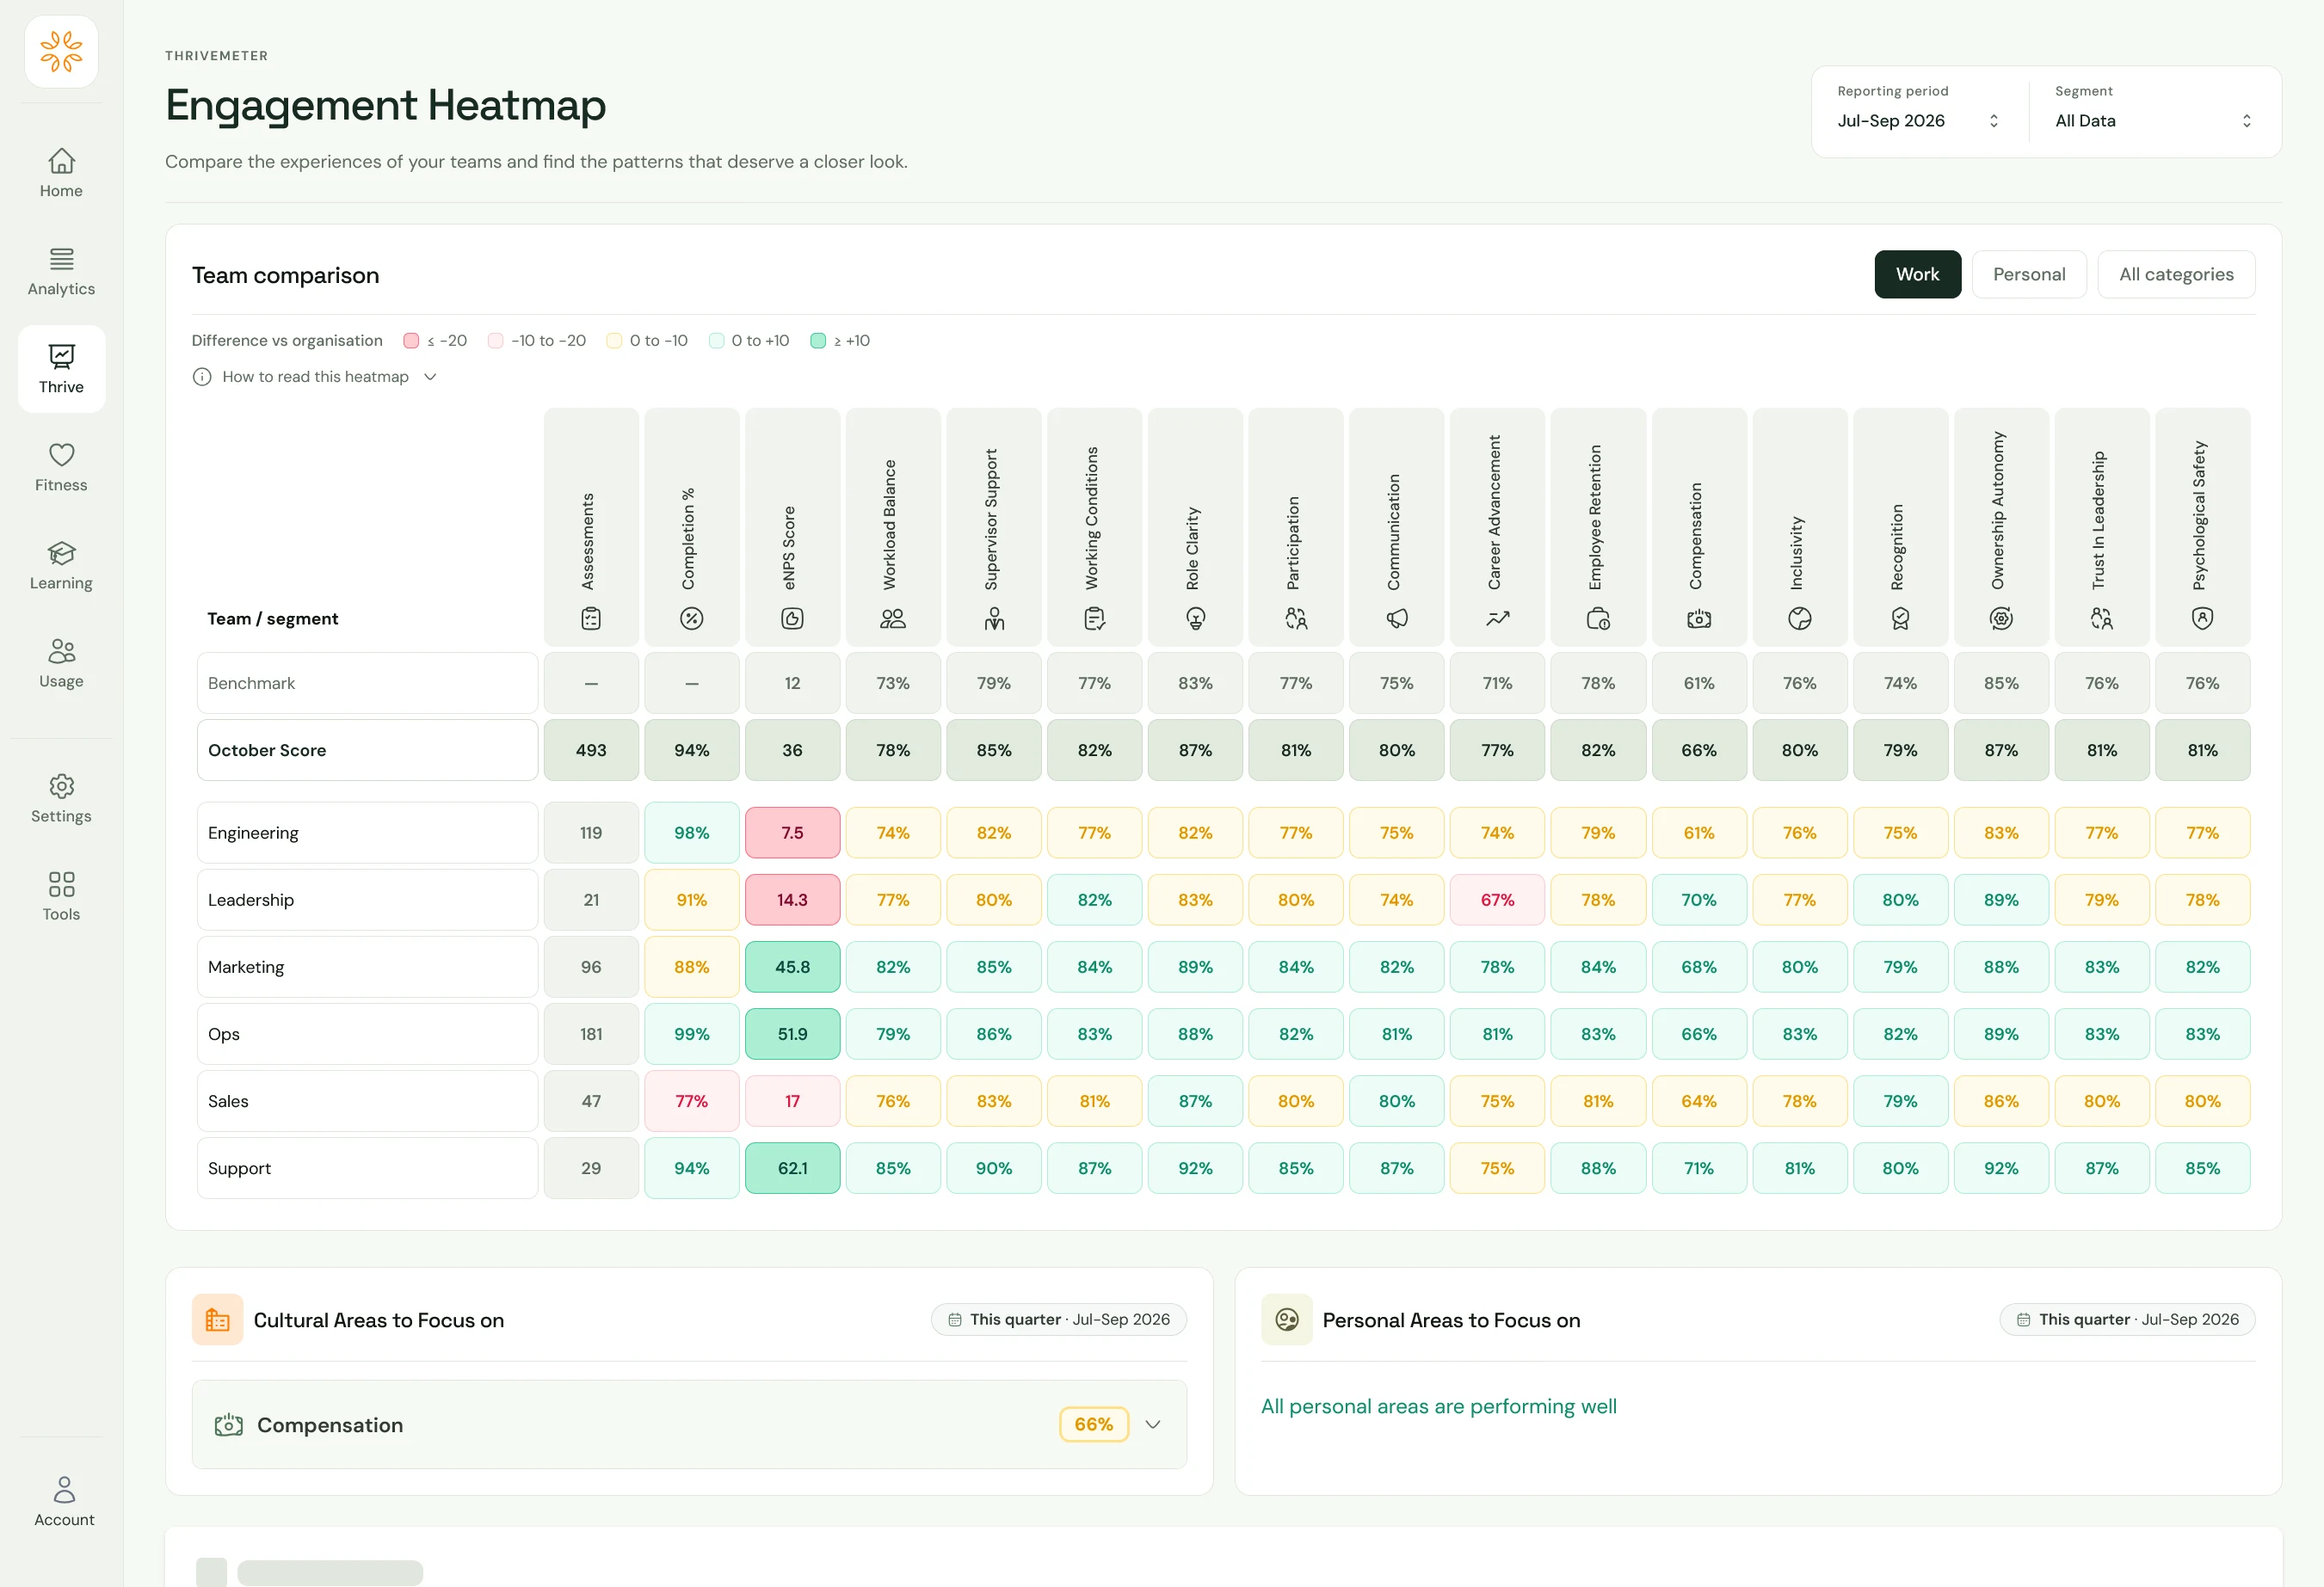
The team comparison sets each segment against the whole organisation across workload, recognition, role clarity, trust in leadership and more. Colour shows how far each one sits above or below, so a struggling team is visible at a glance.

  • Segments from your own groups
  • Colour-coded difference from the organisation
  • Small segments withheld, not shown
Team comparison · Jul–SepIllustrative example

Difference against the whole organisation, in points.

SegmentWorkloadRecog.ClarityTrust
Contact centre−14−6+2−9
Field sales−3−11−4+1
Head office+6+4+8+11
Distribution+2−2+5+3
LegalToo few people to report
10 or more above0 to 9 aboveUp to 9 below10 or more below
Segments under the minimum group size are not reported.

Why

Hear what sits behind the score.

Employee voice turns shared feedback into themes with an estimated share and sentiment. It suggests what to stop, keep and start, and you can select any action to explore it further with Luna.

  • Leading themes and AI-estimated sentiment
  • Stop, keep and start suggestions
  • Explore any suggestion with Luna
Employee voice · Contact centreIllustrative example
41%negative sentiment
33%positive sentiment
Workload management31%
Shift changes at short notice22%
Recognition18%
Communication from leaders14%
StopChanging rotas without notice

Give a week’s warning and the reason.

KeepShort, calm team updates

People value knowing what comes next.

StartReviewing workload with teams

Agree what can move before adding more.

Themes and sentiment are AI-estimated from shared feedback.

What to do

A plan that starts with one move.

Luna turns your weakest areas, compared with the October benchmark, into a prioritised plan. It opens with one place to start, then sorts the rest by impact and effort. Every focus area explains why it matters, its likely drivers and how you will know it worked.

  • A clear first move
  • Actions sorted by impact and effort
  • A measure of success for each area
Your action planIllustrative example
Start here · Workload

Hold a fortnightly workload check-in in each contact-centre team, and act on one change each time.

High impactLow effort
Why this area

Workload sits well below the October benchmark here, and it is the theme people raise most.

Likely drivers
  • Rotas change with little notice
  • Queue targets rose without extra cover
How you will know it worked

Workload moves closer to the organisation in next quarter’s ThriveMeter.

Impact and effort are estimates to sequence the work, not guarantees.

Whether it worked

Check the direction, not just the snapshot.

Quarterly scores show whether an area is moving for the same team. The weekly wellbeing signal shows the trend between quarters. Where there isn’t enough data, Insights leaves a gap rather than guessing.

  • Quarter-on-quarter scores on the same scale
  • A weekly signal per active person
  • Gaps instead of guesses
Contact centre · direction of travelIllustrative example
Workload · quarterly ThriveMeter score
61
Q4
–
Q1
63
Q2
70
Q3

A gap means there was not enough data to report. It is not a zero.

Weekly wellbeing signalTrending up

One quarter, one decision

From a number on a page to a change people notice.

An illustrative example: a 900-person services company, an HR director and a leadership meeting at the end of the month.

  1. Week 1
    HR director

    Opens the executive summary for the quarter. Workload balance is the priority gap; cultural wellbeing and participation are steady.

  2. Week 1
    HR director

    Opens the team comparison. Contact centre and Field sales sit well below the organisation on workload. Legal is too small to report, so it doesn’t appear.

  3. Week 2
    HR director

    Reads employee voice for the contact centre. Short-notice shift changes stand out as a theme.

  4. Week 2
    Luna

    Proposes a first move for workload, with likely drivers and the measure that would show it worked.

  5. Week 4
    Leadership team

    Reviews the executive summary PDF and agrees one change for two teams, not a company-wide programme.

  6. Next quarter
    HR director

    Compares the same two teams on workload and follows the weekly signal in between.

Executive summary · Jul–SepIllustrative example
74cultural wellbeing
88%participation
+21eNPS
Priority gap

Workload balance · 61 / 100. Lowest in Contact centre and Field sales.

Strength to build on

Supervisor support · 84 / 100. Strong in every reported segment.

Download executive summary PDF

Less reporting. More deciding.

How it works

Set up once. Useful every quarter.

  1. 1

    Bring your structure

    Import the groups you lead by, such as departments, sites or regions. They become the segments you compare.

  2. 2

    Let the picture form

    As people use October, their ThriveMeter results and what they share build the organisation’s picture. There is no separate survey to run.

  3. 3

    Review, act, re-measure

    Each quarter, find the gap, understand it, choose a first move and check the same teams next time.

Built for trust

Leaders see the pattern. Never the person.

  • Aggregate only

    Insights reports on groups. Individual answers, scores and conversations are never shown to the organisation.

  • Minimum group sizes

    A ThriveMeter segment needs at least ten people, and scores need enough responses. Below that, results are withheld.

  • Themes, not transcripts

    Employee voice is an AI synthesis across your people: themes and estimated sentiment, never anyone’s conversations.

  • Honest about estimates

    AI-estimated figures are labelled as estimates, and gaps in the data stay gaps rather than becoming zeros.

01 · Executive summary

The whole picture. A clear set of priorities.

Bring cultural wellbeing, participation, employee advocacy and priority gaps into one executive view. See the strengths to build on and where support needs to go.

October Insights — Executive summary. Bring cultural wellbeing, participation, employee advocacy and priority gaps into one executive view. See the strengths to build on and where support needs to go.
Executive summary · Open the image to explore the full-size product view
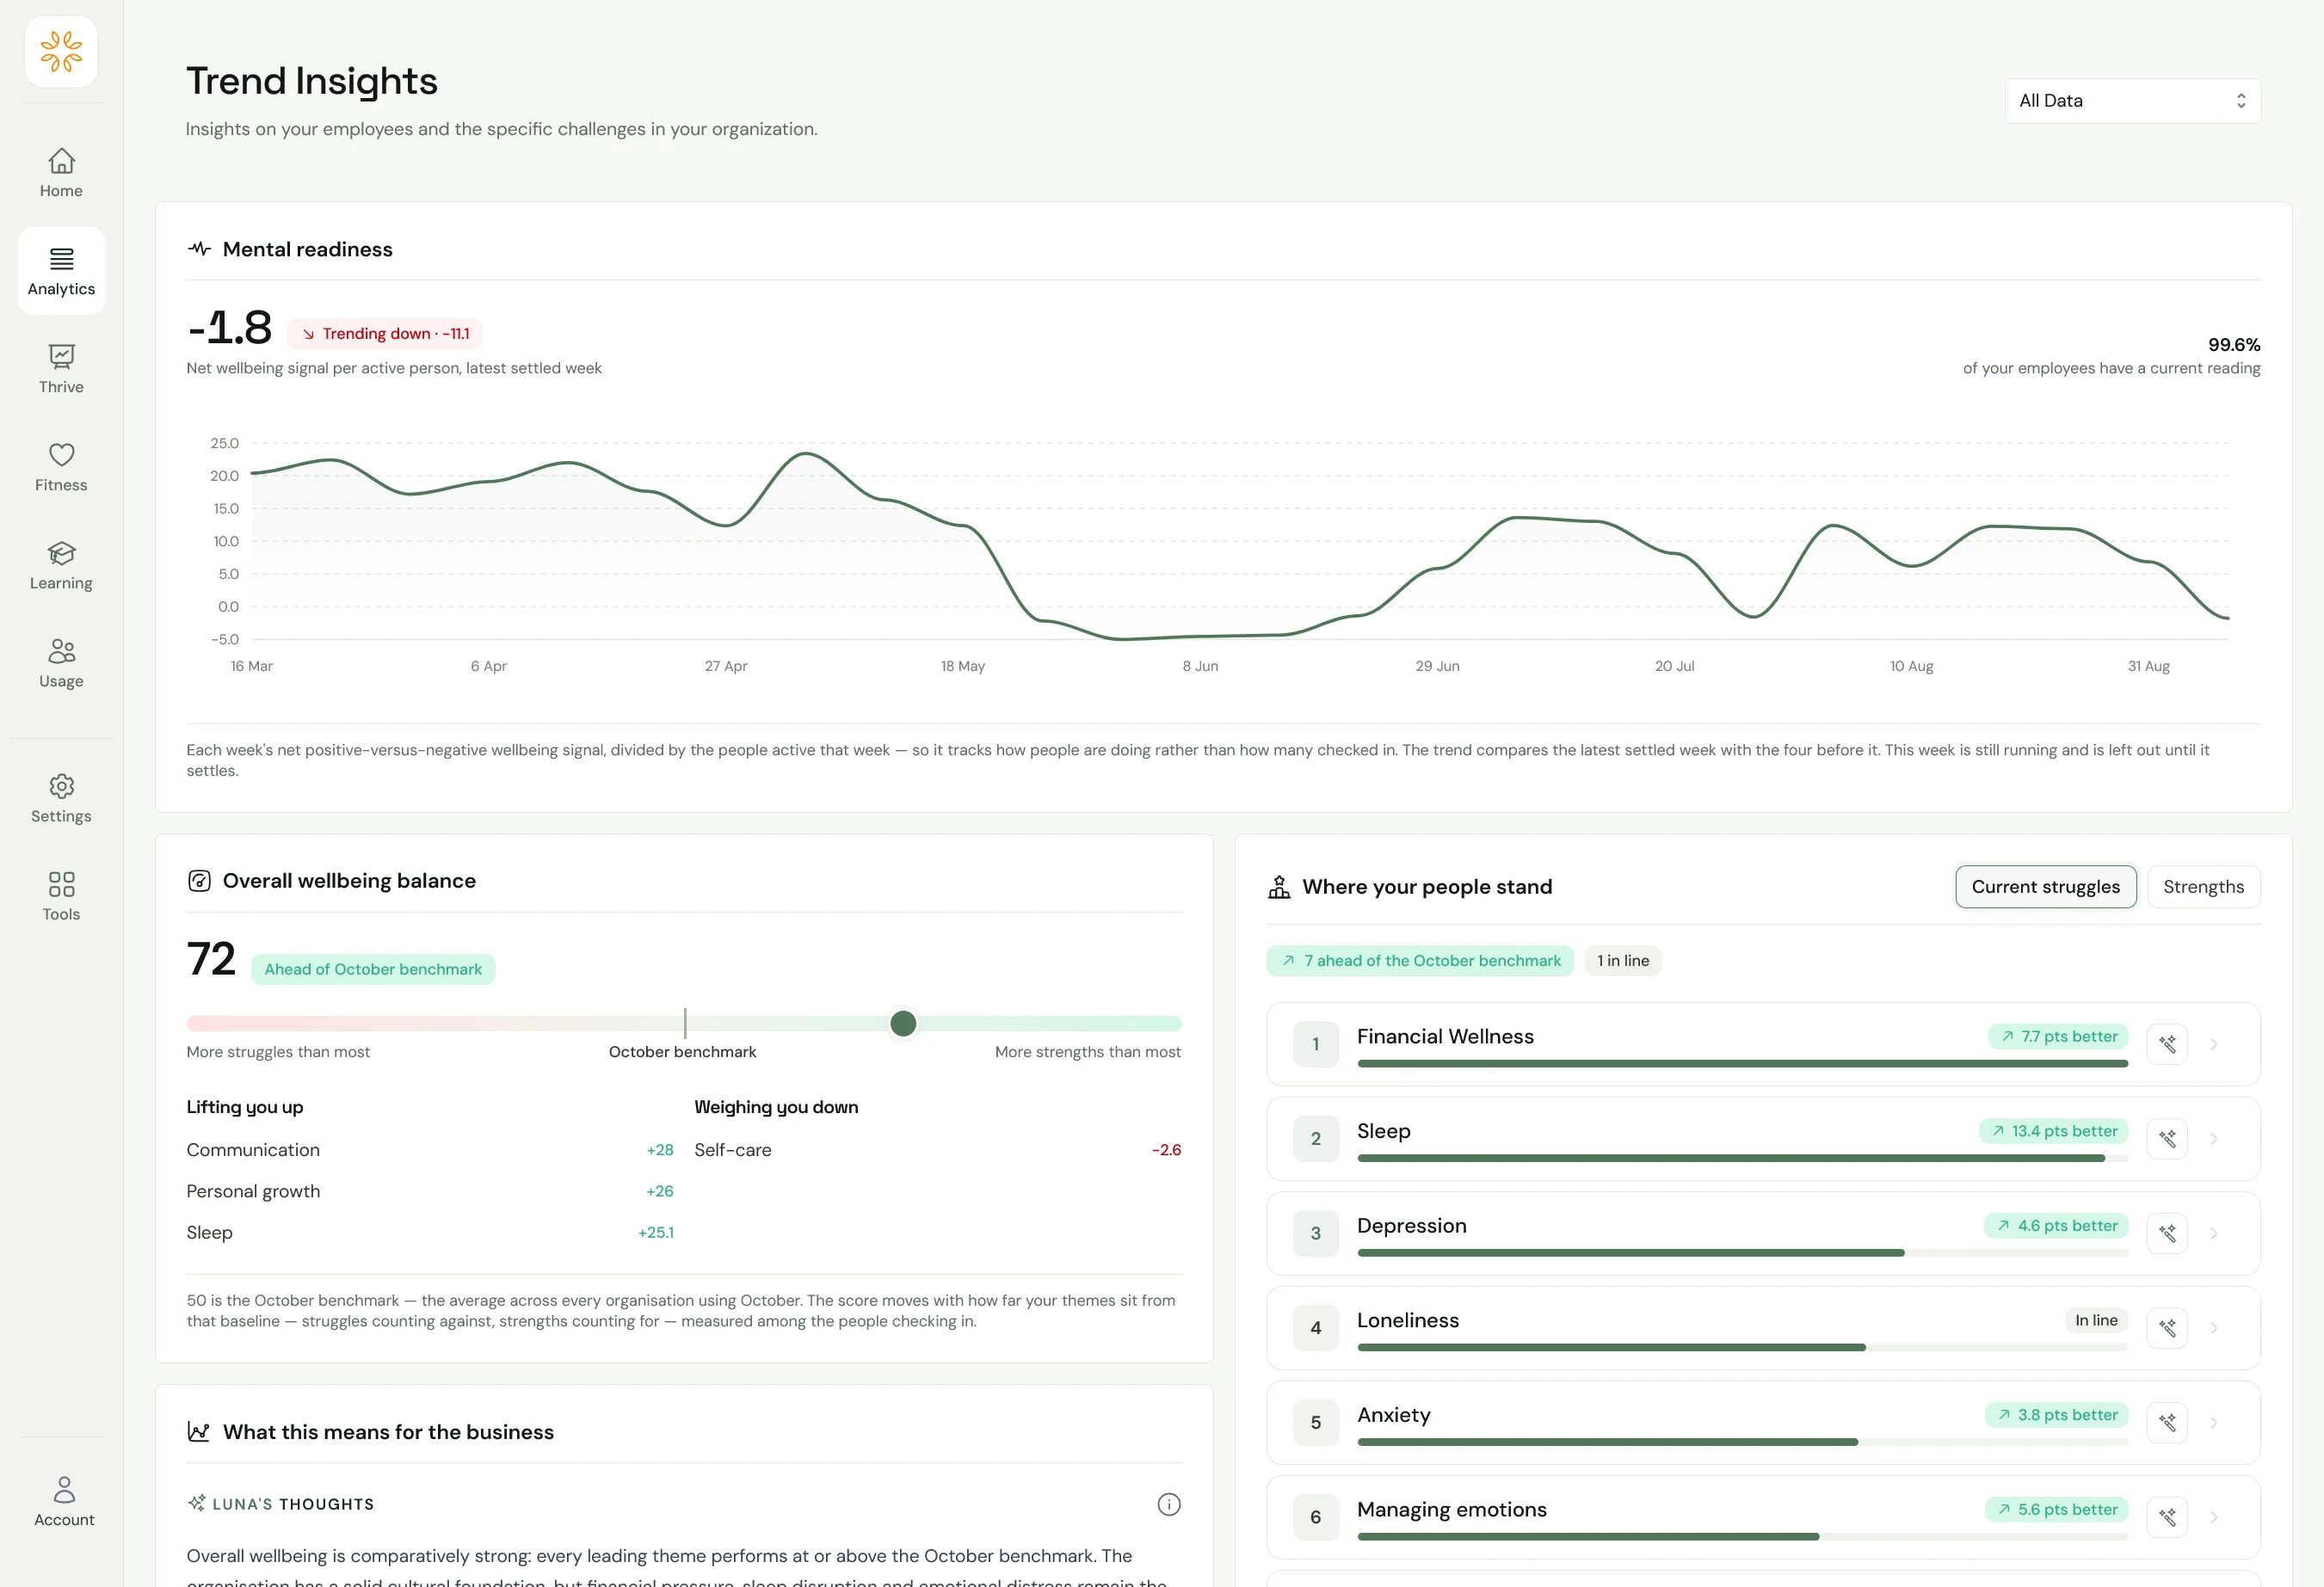
02 · Engagement heatmap

See where experiences diverge.

Compare teams and segments across workload, role clarity, recognition, trust and more. Benchmarks and colour-coded comparisons make the areas that need attention easier to find.

October Insights — Engagement heatmap. Compare teams and segments across workload, role clarity, recognition, trust and more. Benchmarks and colour-coded comparisons make the areas that need attention easier to find.
Engagement heatmap · Open the image to explore the full-size product view
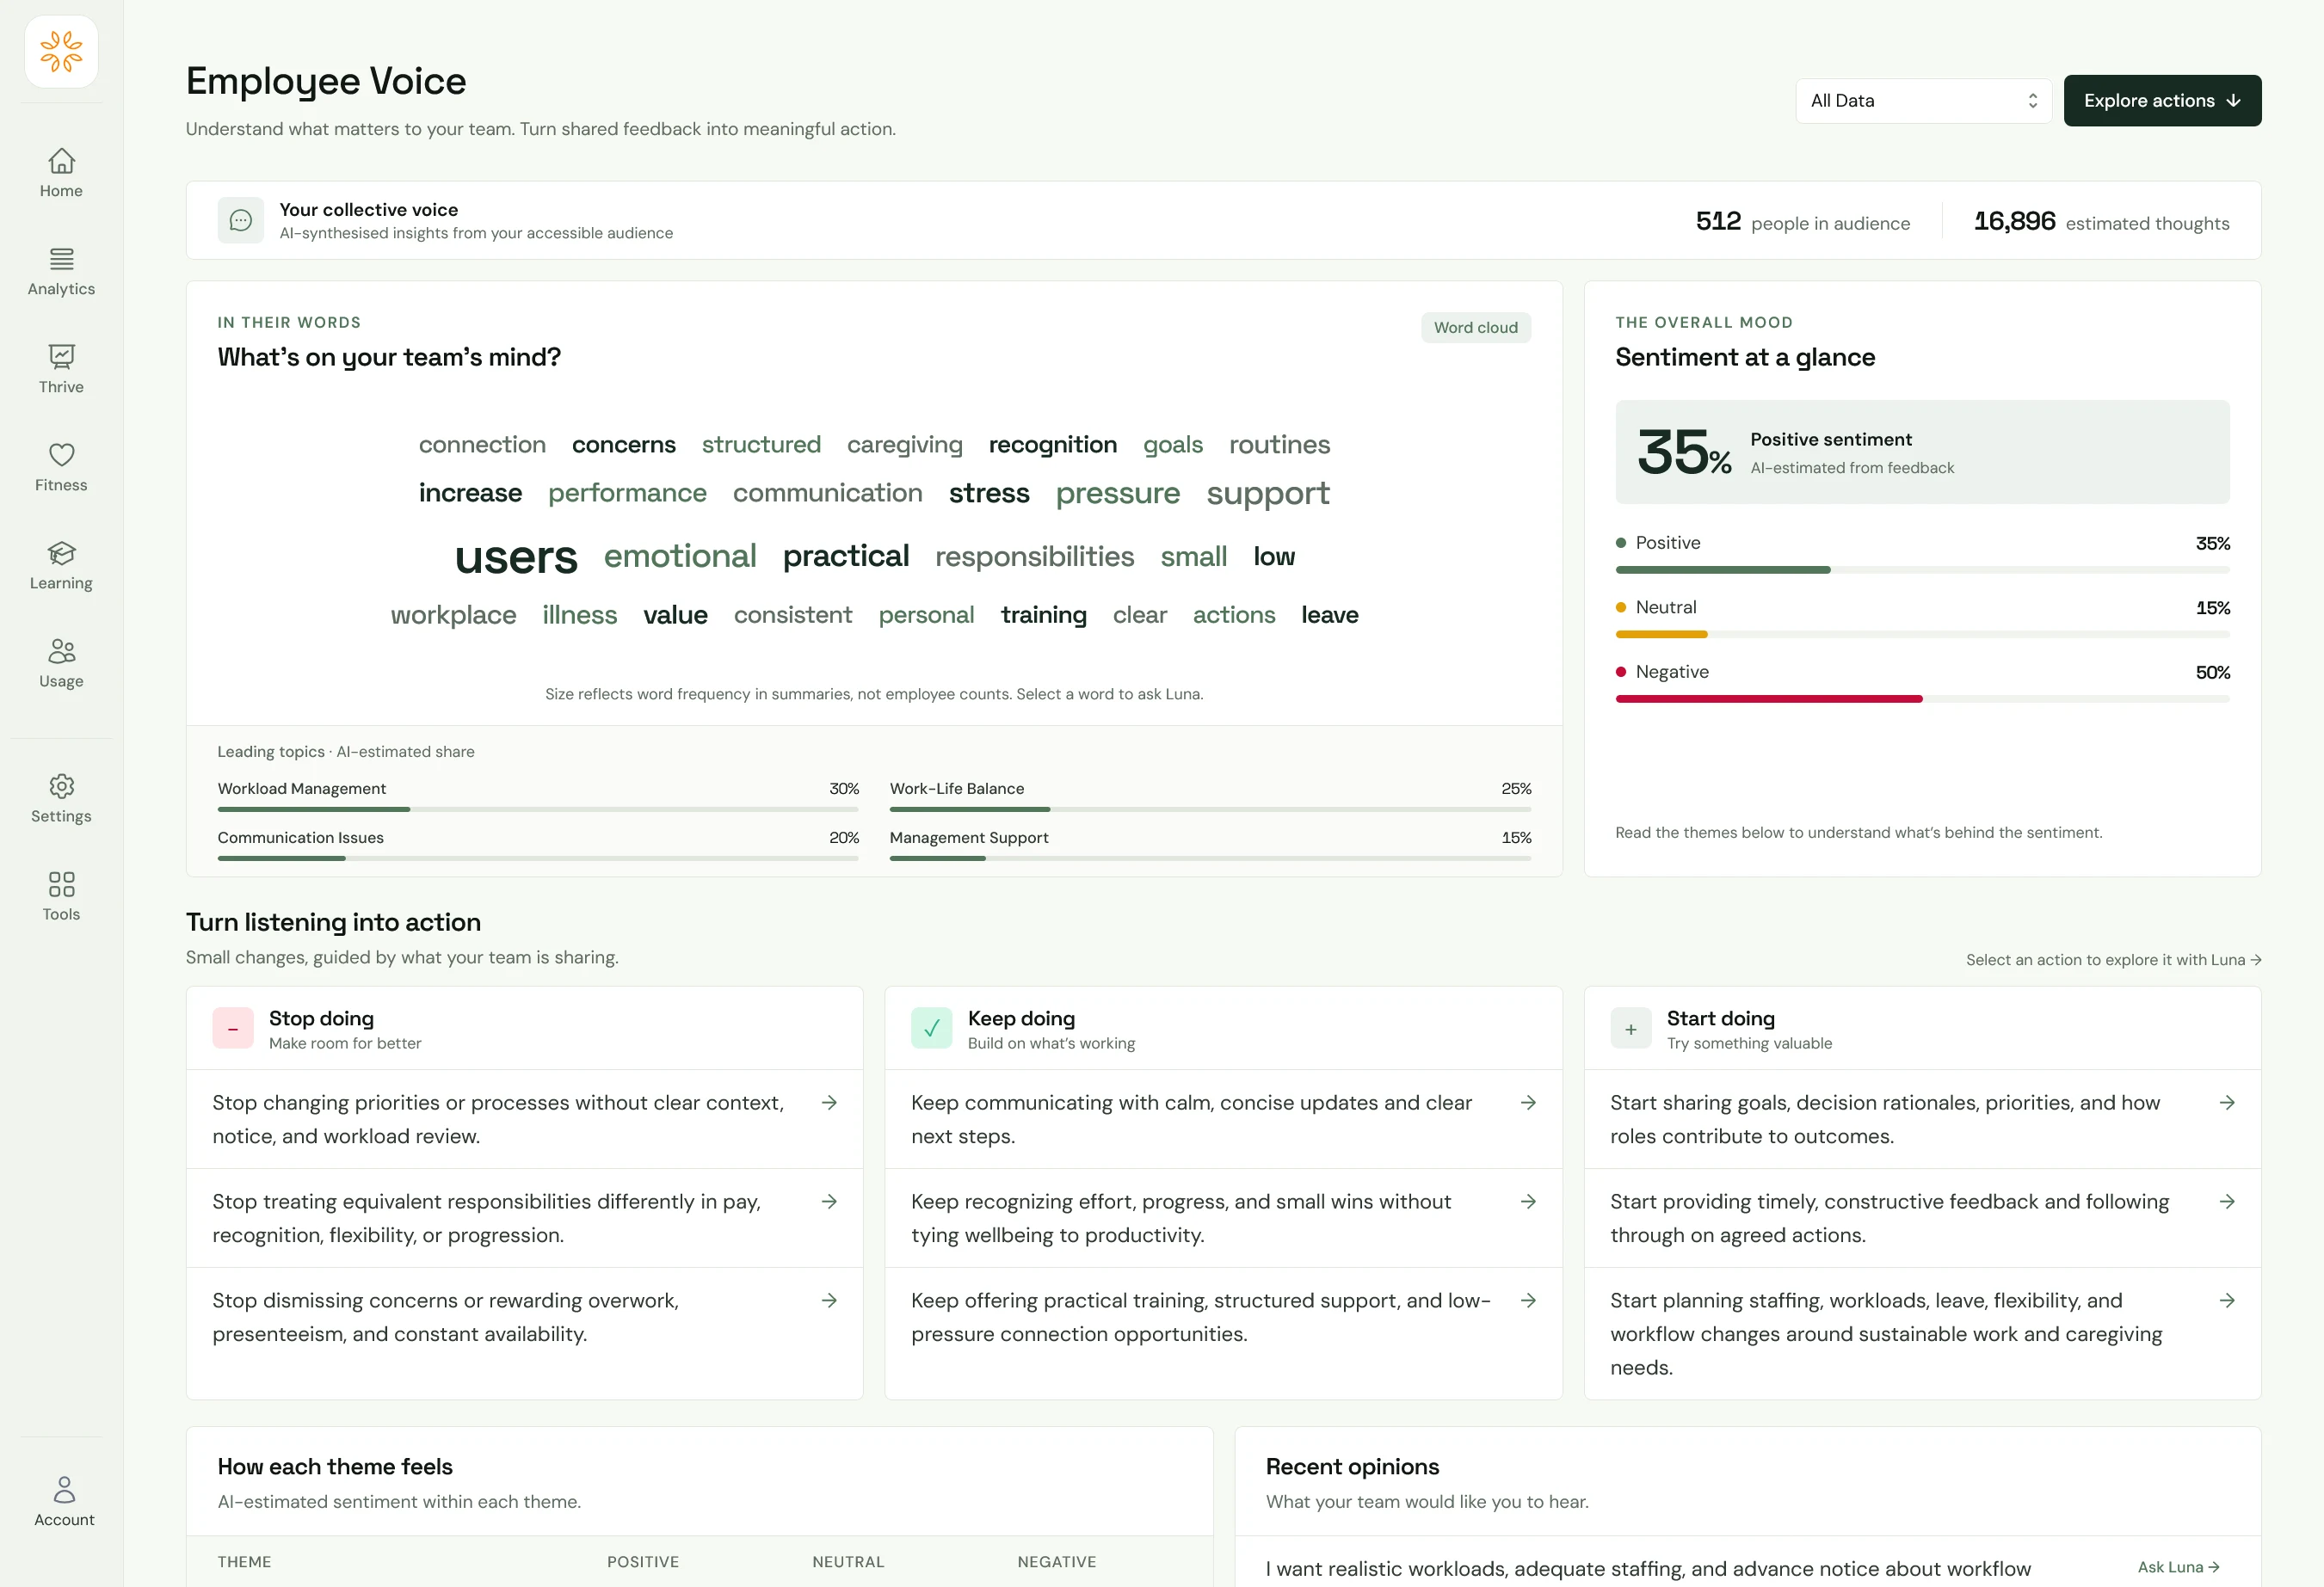
03 · Employee voice

Hear the themes behind the numbers.

AI brings shared feedback into focus through themes, estimated sentiment and practical suggestions for what to start, stop and keep doing.

October Insights — Employee voice. AI brings shared feedback into focus through themes, estimated sentiment and practical suggestions for what to start, stop and keep doing.
Employee voice · Open the image to explore the full-size product view
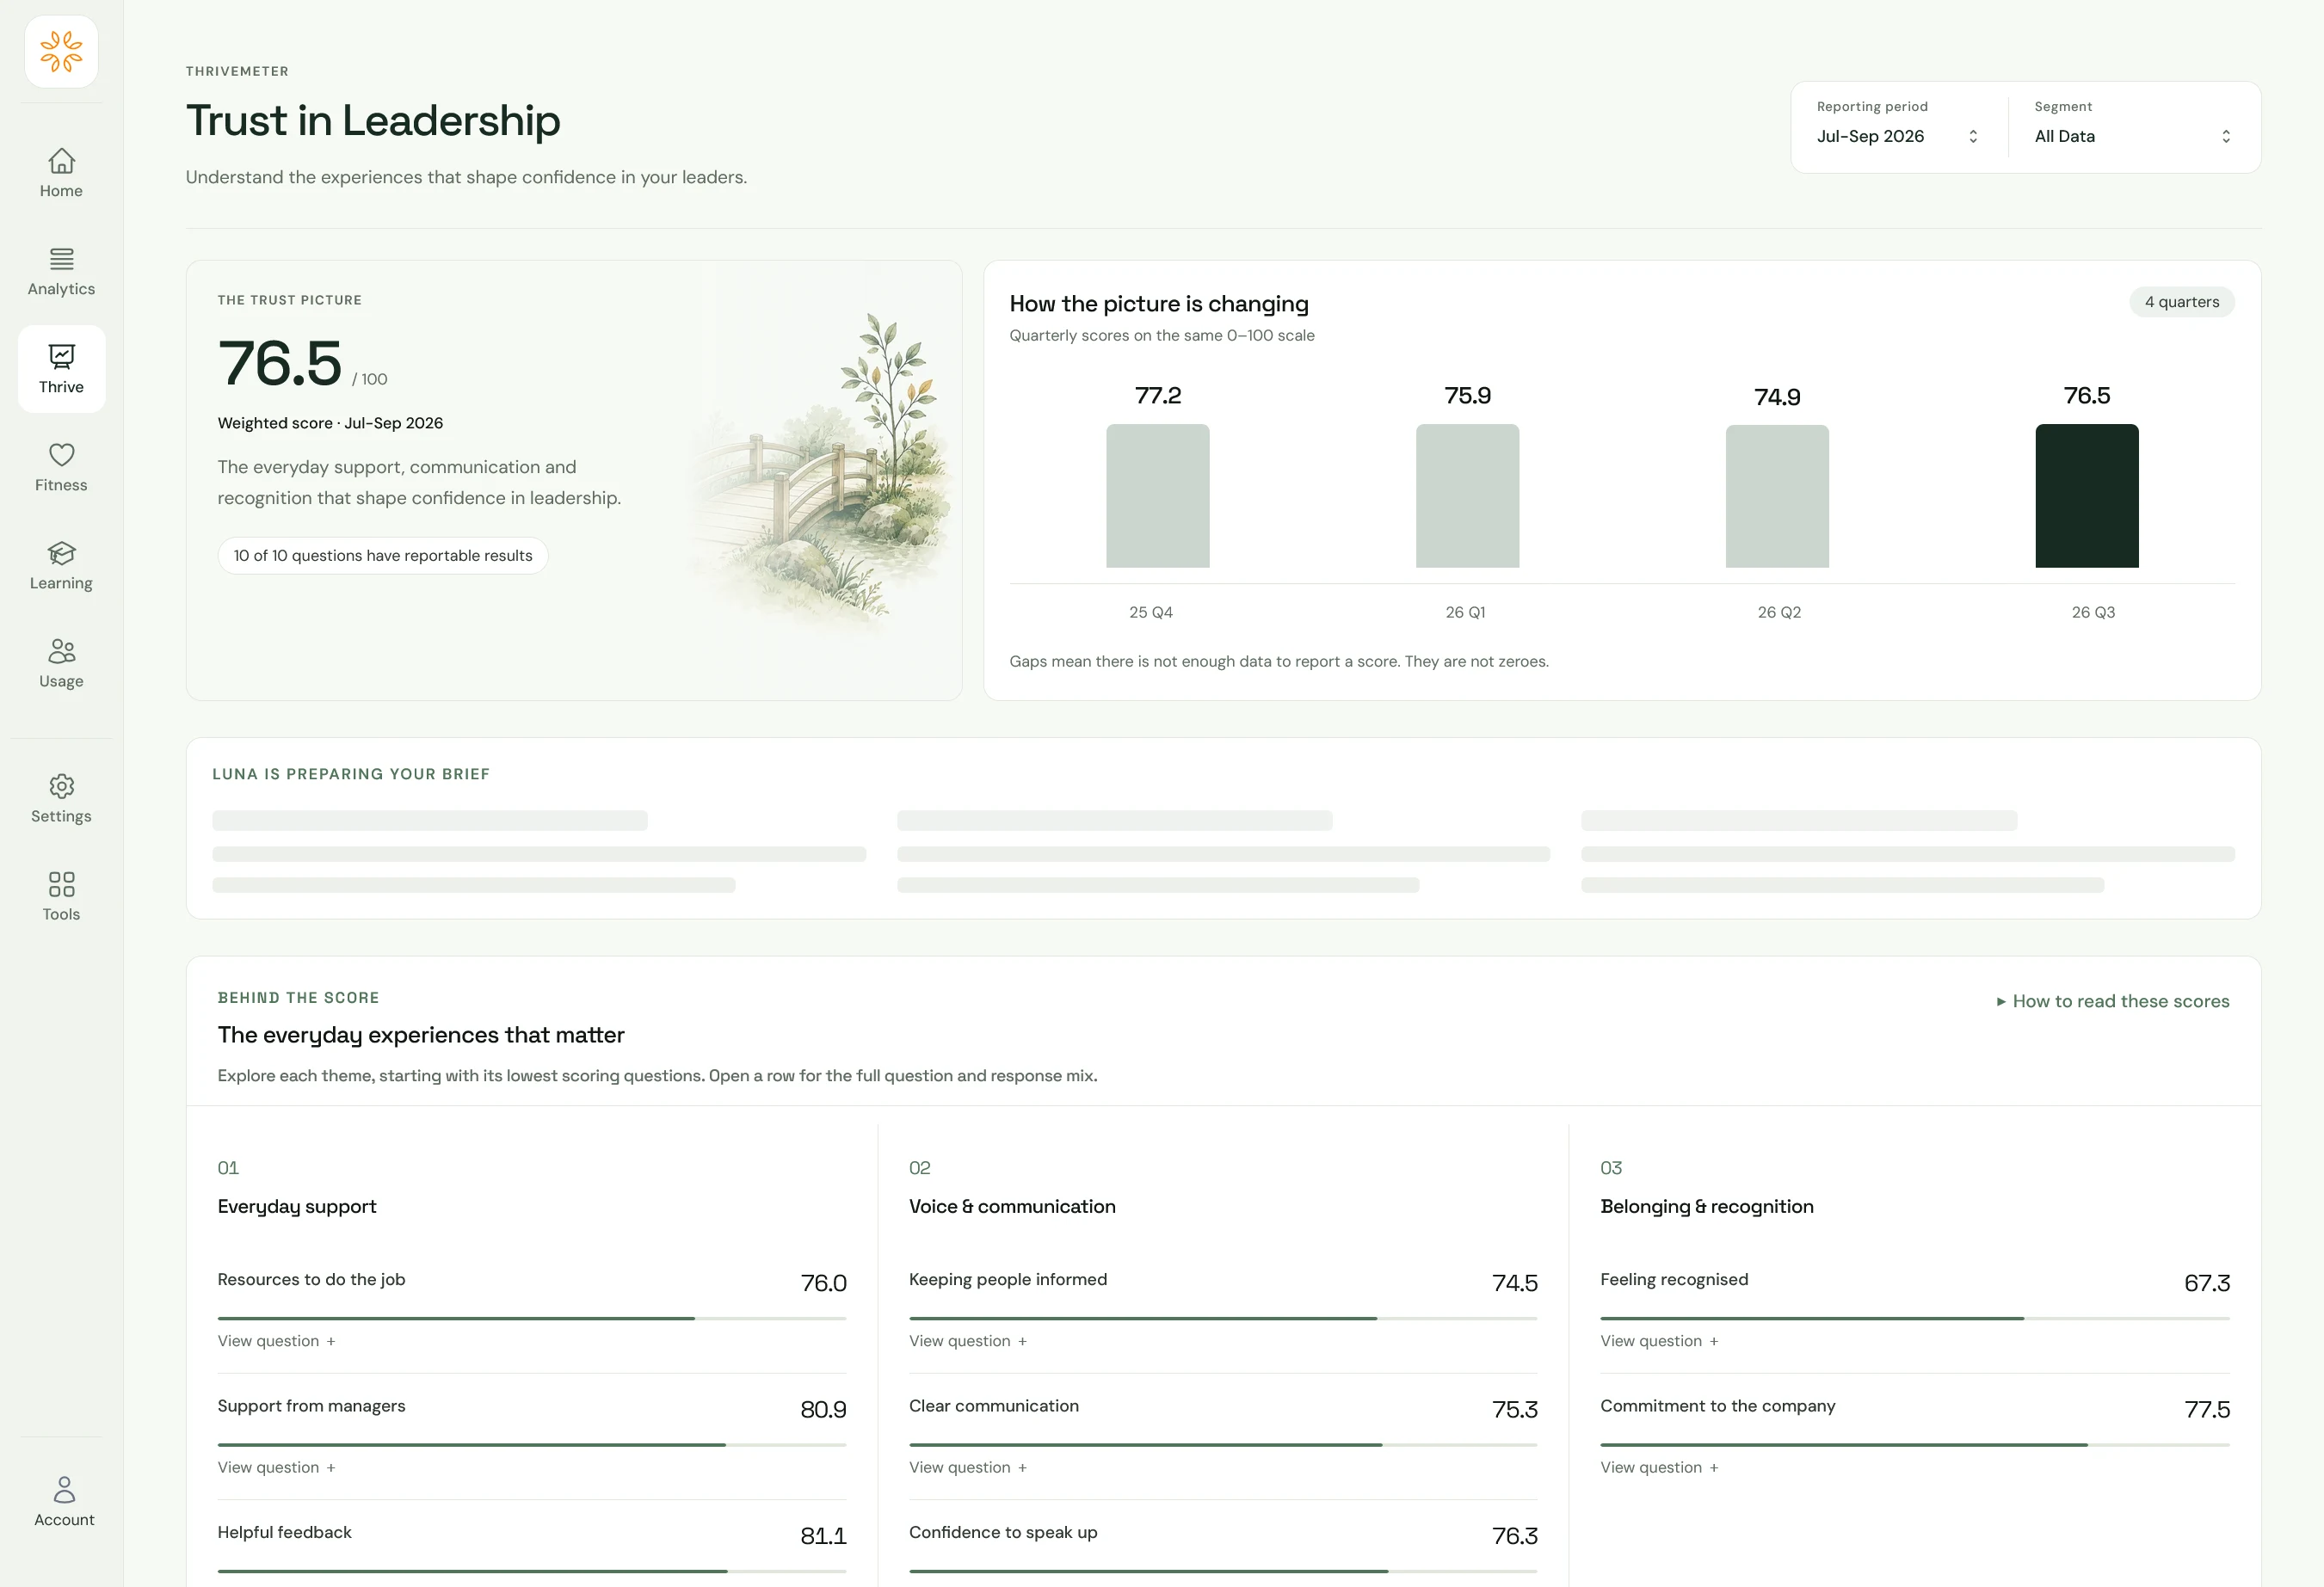
05 · Trust in leadership

Look beneath the leadership score.

Explore the everyday support, communication and recognition that shape confidence in leaders. Follow quarterly changes and examine the questions behind the score.

October Insights — Trust in leadership. Explore the everyday support, communication and recognition that shape confidence in leaders. Follow quarterly changes and examine the questions behind the score.
Trust in leadership · Open the image to explore the full-size product view
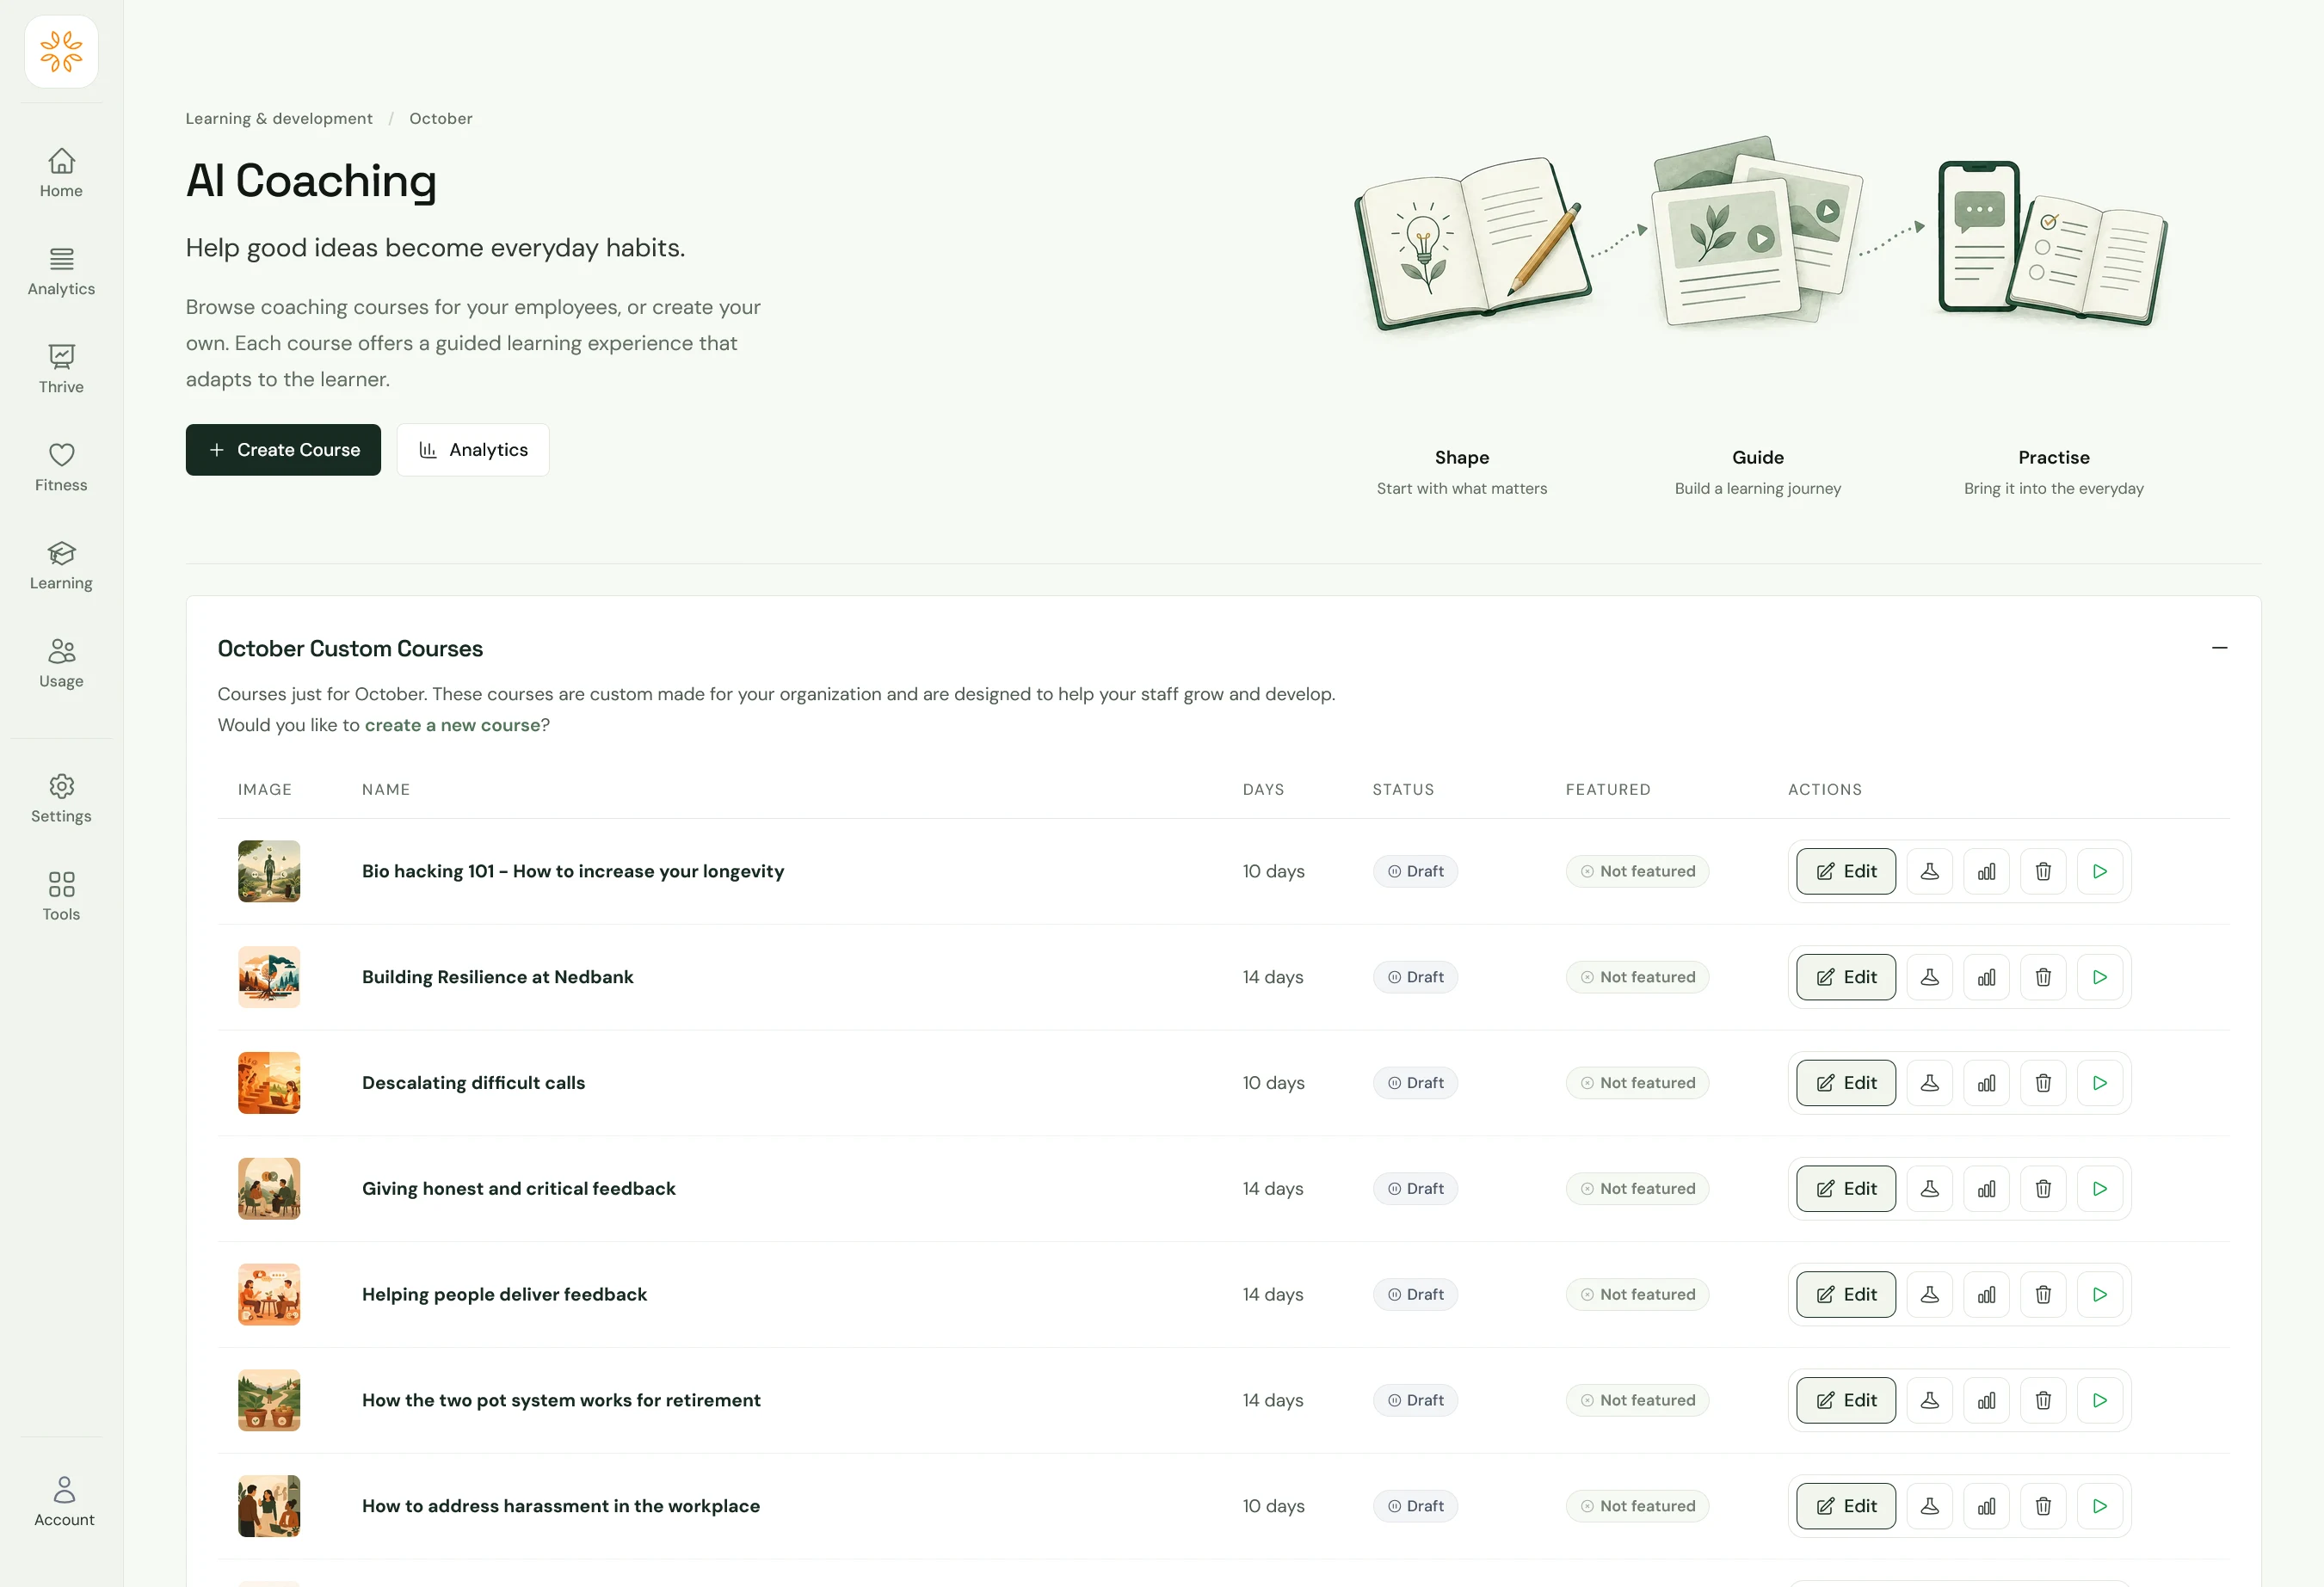
06 · Learning & action

Turn understanding into everyday change.

Bring the response back to your people. Browse coaching courses, create learning for your organisation and review analytics as people build new habits.

October Insights — Learning & action. Bring the response back to your people. Browse coaching courses, create learning for your organisation and review analytics as people build new habits.
Learning & action · Open the image to explore the full-size product view

Understand the organisation through aggregated information. Personal conversations stay private, and minimum group sizes protect reporting across smaller teams.

How privacy works
Connected to October Health

Find the focus.
Bring support to people.

Insights helps leaders understand what needs attention. October Health puts the support, company programmes and learning into people’s everyday experience.

  1. Measurement & surveys

    Explore pulse, ThriveMeter and the tools that help people reflect.

  2. Your organisation

    Connect the response to company programmes and leadership development.

Start with your organisation

See what your organisation can become.

Tell us what your team needs. We’ll walk you through the relevant features, support options and how to get started.