
The operating system for organizational performance.
October connects the full people stack — mental fitness, performance, reviews, HR and embedded experts — into one intelligence layer. See what's happening, understand what matters, act where it counts.



Existing user? Jump back in.
Noise→signal
A workforce generates thousands of weak signals a week — a missed check-in, a workload spike, a manager change. On their own they are noise. Together they are the shape of your organization.
8.4% of your people are struggling.
Not an average. Not a pulse score. The actual shape of your organization — recomputed every night, with the tail intact.
Only the top 10% of your business receives investment.
Executive coaching goes to the leadership team. The EAP catches the people already in crisis. The 81% in the middle — where performance is merely average, and where almost all of your output comes from — gets a benefits brochure.
Move the middle and the business moves.
One point across 81% of your people is worth more than ten points across 8%. A service everyone actually uses obliterates an EAP that reaches only the struggling, or coaching reserved for executives.
Reach is the whole argument.
Most wellbeing programmes sit unused — a few percent of staff ever log in, so they only ever touch the tail. October reaches 65% utilisation, around ten times the typical EAP, which is what makes moving the middle possible at all. One customer went from 1.4% adoption to 55%.
- 5–15%
- 65%
- 10×
See the company in section.
Most dashboards hand you the top layer and call it culture. October cuts down through all five, on the same clock, against the same record — and shows you which one is actually load-bearing.
Engagement
Continuous check-ins rather than an annual survey nobody trusts — measured in the flow of work, not in a two-week window.
+49Burnout
Load, recovery and strain per team, mapped as a heat surface. The hot cells are where attrition starts three quarters from now.
12.4%Performance
Resilience, focus and adaptability scored against delivery — the behavioural base underneath every output metric you already track.
78.4Retention
Survival curves by cohort, tenure and manager. Flight risk surfaces as a bend in the curve long before a resignation lands.
94.1%Efficiency
The only measure that compounds the other four: how long it takes a detected signal to become a change someone actually feels.
48h
Measurement is only half of it. The loop closes.
One system that helps companies understand their people, make better decisions, and turn insight into change you can measure the next time round.
Data
What is really happening.
Behavioural, operational and engagement data from across the organisation, unified in one system — not scattered across a wellbeing app, a survey tool and an HRIS.
Decision
Where leaders should act.
Prioritised insight that ranks the few moves that will actually move performance, surfaced ahead of the lagging indicators everyone else waits for.
Action
Measurable change.
Executed through October Health, October People and embedded experts. Software paired with a team that drives the change — and owns the ROI.
An early signal surfaces.
Burnout, disengagement, a team under strain — a weak signal reaches the surface long before it ever shows up in attrition.
The whole picture, one view.
Behavioural, operational and engagement data from across the organisation, unified — so you see what's really happening, not one slice of it.
A focused plan, not a report.
Prioritised insight and a small set of focused interventions — owned by your embedded expert, not left on a slide.
Measurable change.
Executed through Health, People and Advisory. Engagement, retention and performance move — and you can see the change in the data.
- Support
- Engineering
- Sales
- Finance
Each works on its own. Together they compound.
Take what you need. Every module you add reads against the same record, so the intelligence sharpens as you grow — Health and People are the software you run on, Advisory the team that turns signal into outcomes.
Health
Performance psychology that supports employees from the ground up and gives leaders the behavioural data to improve culture from the top down.
- 65%
- 24/7
- 11
People
An AI-first HR workspace from the first interview to the final goodbye — hiring, payroll, performance, learning, compliance and the 30+ modules in between, running as one.
- 30+
- 4
- One
Advisory
The embedded expert team. Psychologists, strategists and data scientists who turn your platform's signal into the few moves that matter — and stay accountable for the outcome.
- 48h
- Monthly
- Named
- Scope
- The whole organisation.
- One slice each.
- Model
- Software and embedded experts.
- Software or experts, never both.
- Adoption
- 65% utilisation, 10× the EAP.
- A few percent ever log in.
- Insight
- Prioritised — what to do next.
- A dashboard you interpret yourself.
- Action
- Experts who execute the change.
- A report, and good luck.
- Stack
- One intelligence layer.
- Four tools, four invoices.
- Outcome
- Measurable change in performance.
- Activity metrics.
The whole organisation.
One slice each.
Software and embedded experts.
Software or experts, never both.
65% utilisation, 10× the EAP.
A few percent ever log in.
Prioritised — what to do next.
A dashboard you interpret yourself.
Experts who execute the change.
A report, and good luck.
One intelligence layer.
Four tools, four invoices.
Measurable change in performance.
Activity metrics.
What changes for the customer. The outcomes that follow.
- 01
The behavioural and skill base for performance.
Higher resilience, focus and adaptability across the workforce. People who deliver under pressure and through change. Capability retained when it matters most.
- +23 pts
- 02
Earlier signal, earlier action.
Spot disengagement, burnout and team breakdowns before they show up in attrition. Reduce people-side compliance, conduct and culture risk.
- 94.1%
- 03
Elevate HR from operational to strategic.
Cleaner HR operations. Better data behind comp, leave, talent and performance decisions. Less manual work, more time on what matters.
- 48h
Better people decisions. Stronger teams. Performance that compounds.
Higher engagement, according to the teams who've run it for a full quarter.

We've seen fantastic adoption and utilisation of the platform. The insights and data empower us to implement targeted initiatives that truly benefit our staff.
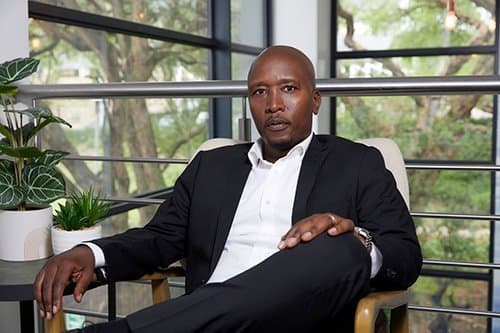
We face complex challenges and high-pressure situations daily. To excel, we need more than technical expertise; we need clarity, composure, and resilience.
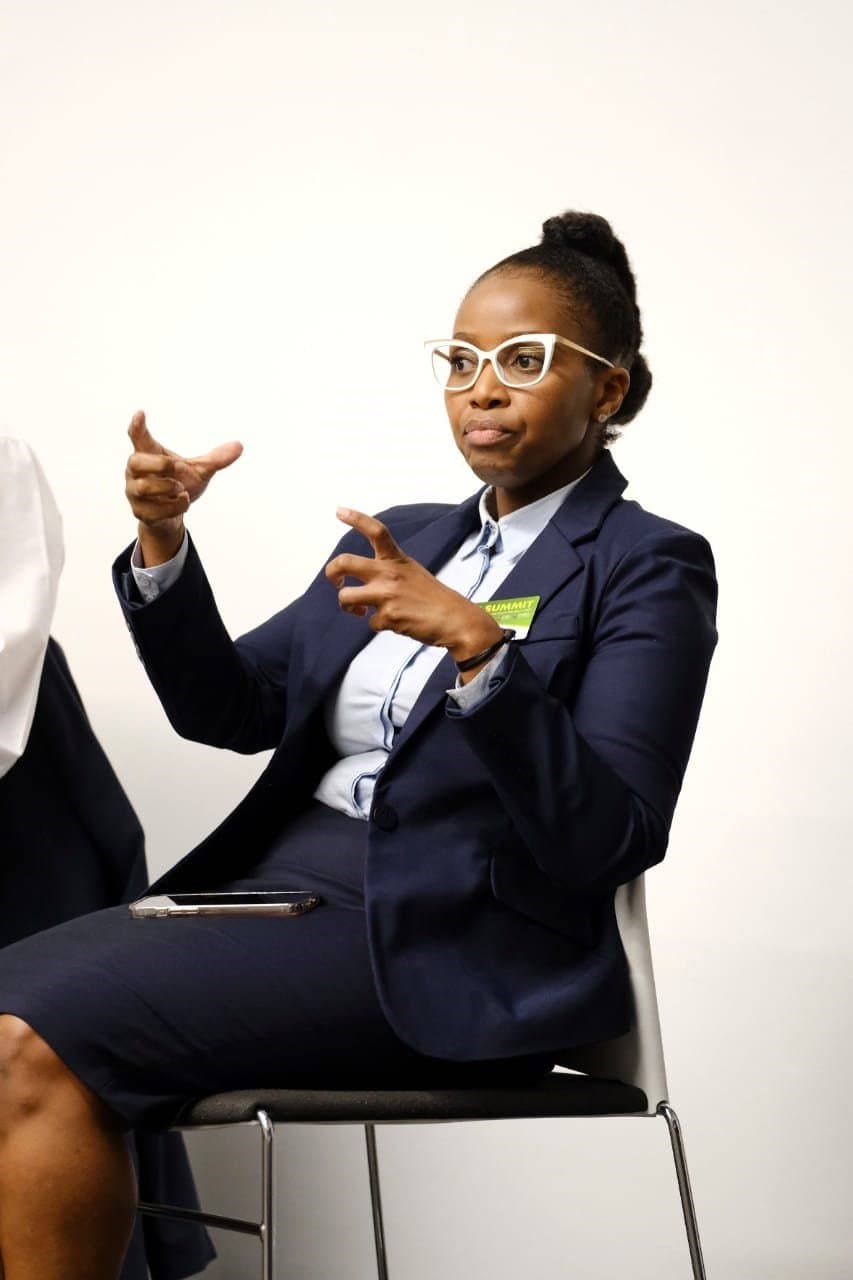
Through October we continue to draw insights to understand where to bolster support and design a fit-for-purpose wellbeing plan for the year.

Our industry demands a lot from our people — high performance, tight deadlines, and constant problem-solving. That's why we've partnered with October Health.
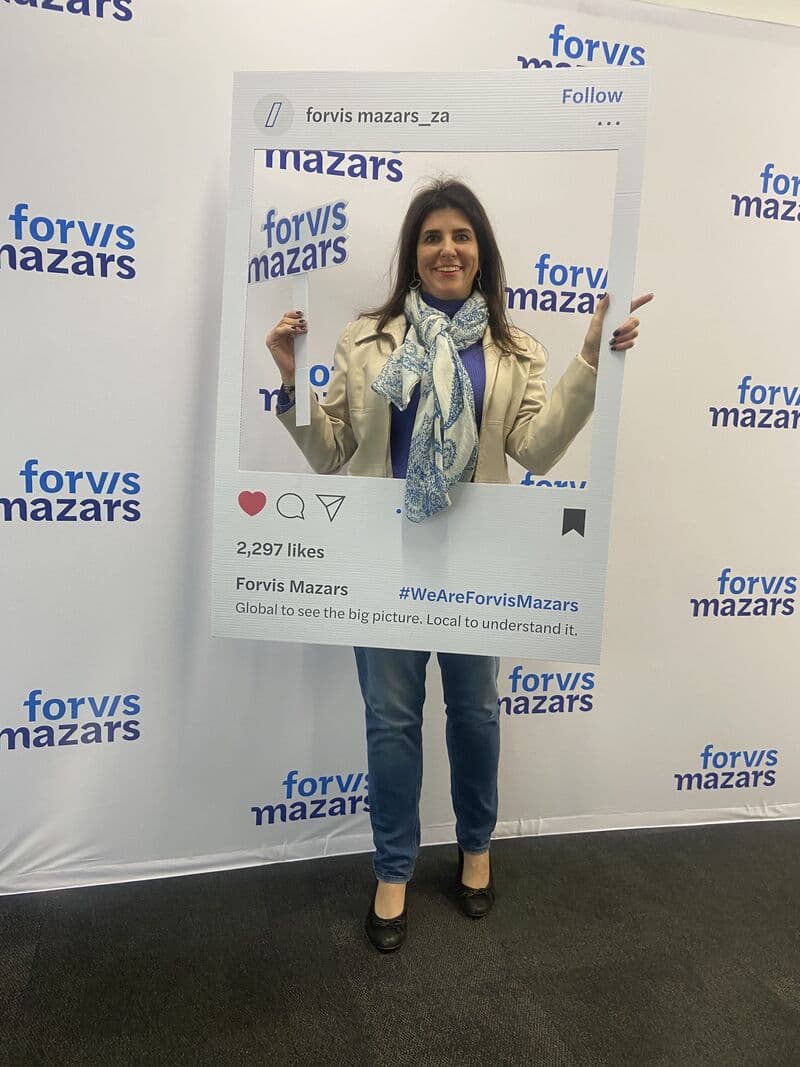
We now understand what wellbeing challenges are most important to our staff and can craft specialised interventions with the October team. The entire October team is a pleasure to deal with.
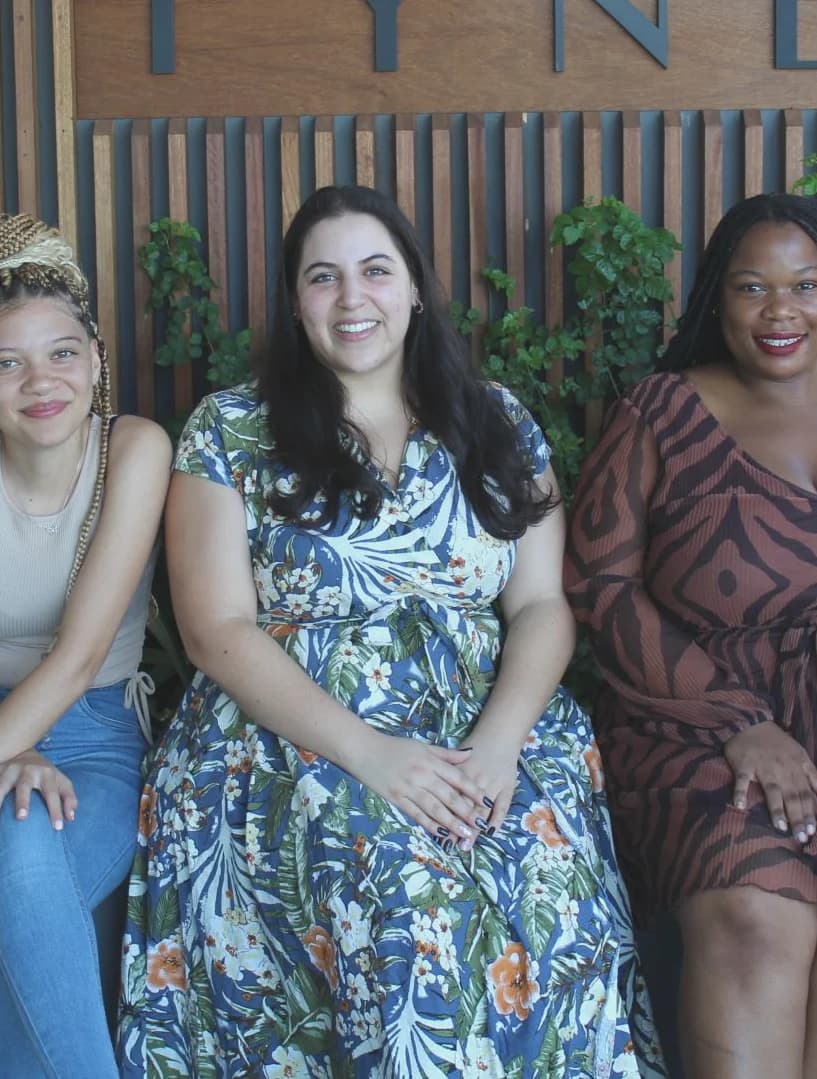
October Health has changed the wellness game at our company! Our previous EWP garnered 1.4% adoption — with October we are at 55%.

Our people are at the heart of everything we do. To truly support them, we need to understand their needs in a meaningful way — that's why we've partnered with October Health.
Exchanges, law firms, insurers. Same instrument.
From a national stock exchange to a global audit firm — organisations that cannot afford to guess about their people.
One of the largest stock exchanges runs October.
A global audit and advisory firm partners with October.
A leading medical scheme supports its people with October.
A top business school brings October to its people.
A leading international law firm runs October.
A major retail platform partners with October.
Score your business in 2 minutes.
Benchmark your workplace across the drivers of performance and retention — free, no signup, with a costed PDF of what the gap is worth.
See what's really happening.
Book a walkthrough and we'll show you the data, the decisions it surfaces, and the team that drives the change.